
Choosing the right charting library for your React project is daunting. If your project has a lot of data visualization, then there is a lot riding on the library that you pick from the start. You don’t want to invest hours of dev time, only to realize that you should have selected a different library!
What’s more, you don’t have unlimited time to try every charting library out there. That’s why I’ll be sharing our pick of the best React Charting Libraries in 2023. We’ll narrow the field so that you can get coding faster.
Here are the libraries we’ll review:
- react-chartjs-2
- nivo
- Recharts
- Victory
- visx
- React Charts
Bonus: react-vis
Bonus: React Stockcharts
#1 react-chartjs-2
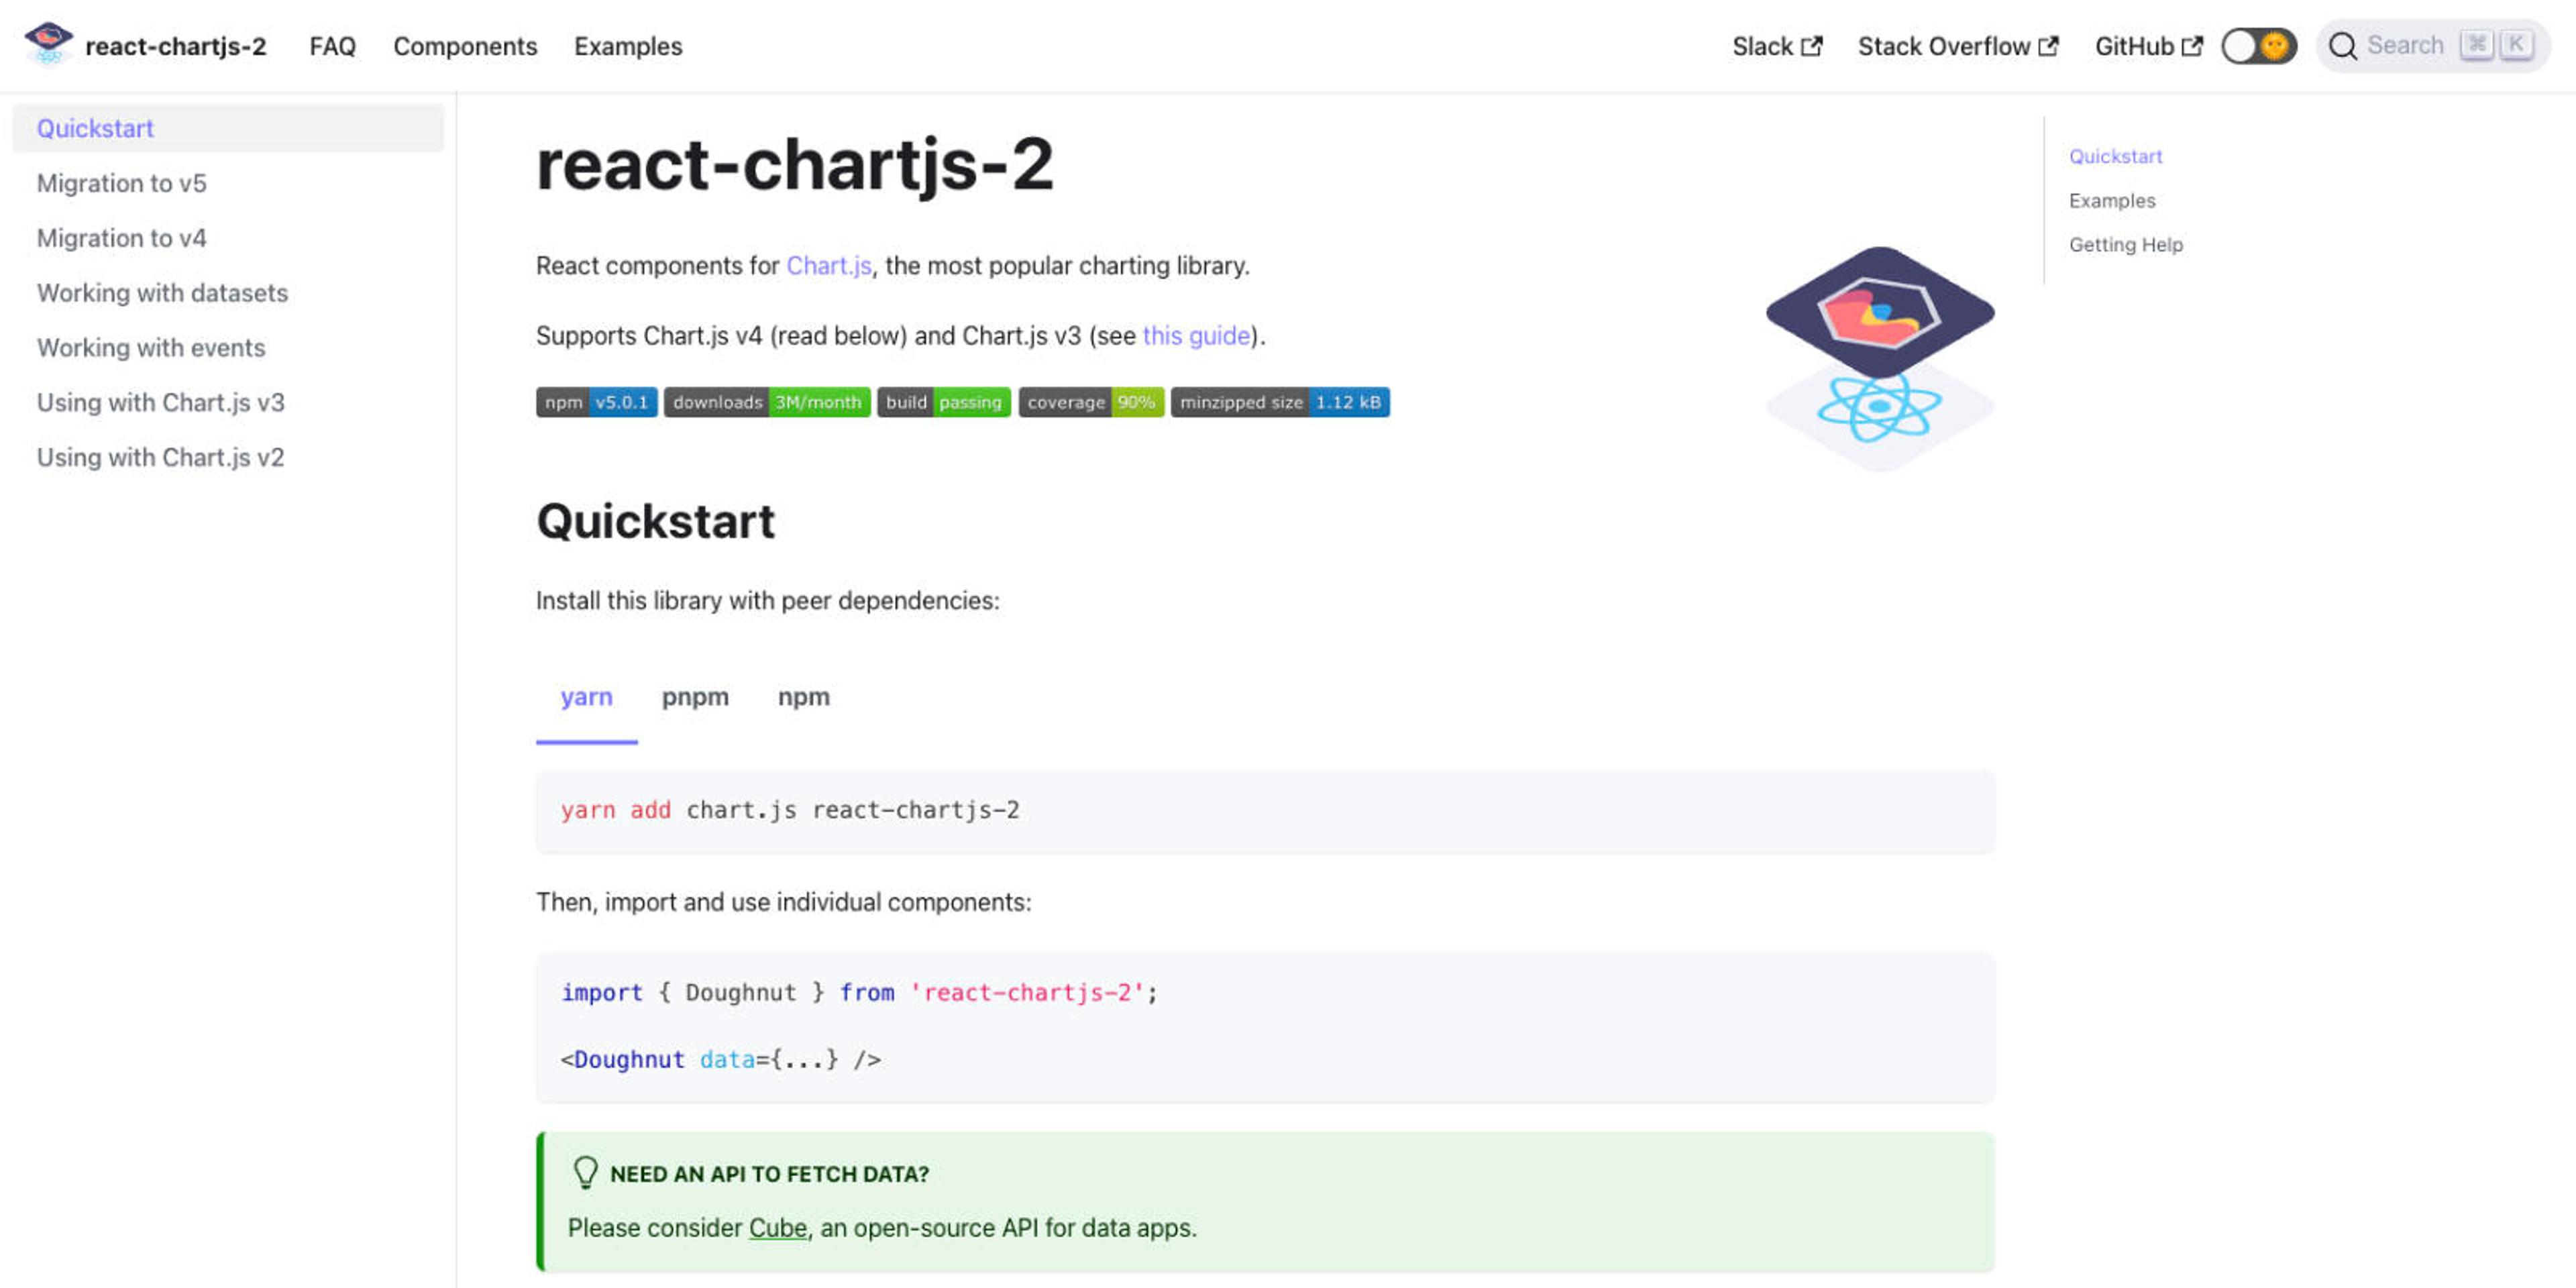
If we were looking for the best JavaScript charting libraries then Chart.js would be a clear contender for the top spot. So it makes sense that react-chartjs-2 is our top choice for React charting libraries.
GitHub stars (5.5k) and monthly downloads (3.1M/month) aren't the only factors that we consider when picking our favorite library. react-chartjs-2 is one of the most well-maintained libraries. Even though it only has a sole author. This means that it has an active community of contributors making updates and fixing bugs
Features
- Active open-source community
- All modern browsers and IE11+ compatible
- Responsive
- 9 customizable chart types
Chart Types
Conclusion
We love how focused and easy it is to get started with this library. And you'll still have the option for more complex chart customizations. It has an excellent list of usable examples that show a variety of use cases. So you'll be able to check if react-chartjs-2 is right for your project. Combine this with its great community and well-maintained repo. It’s easy to see why we’ve picked react-chartjs-2 as our top React charting library.
#2 nivo
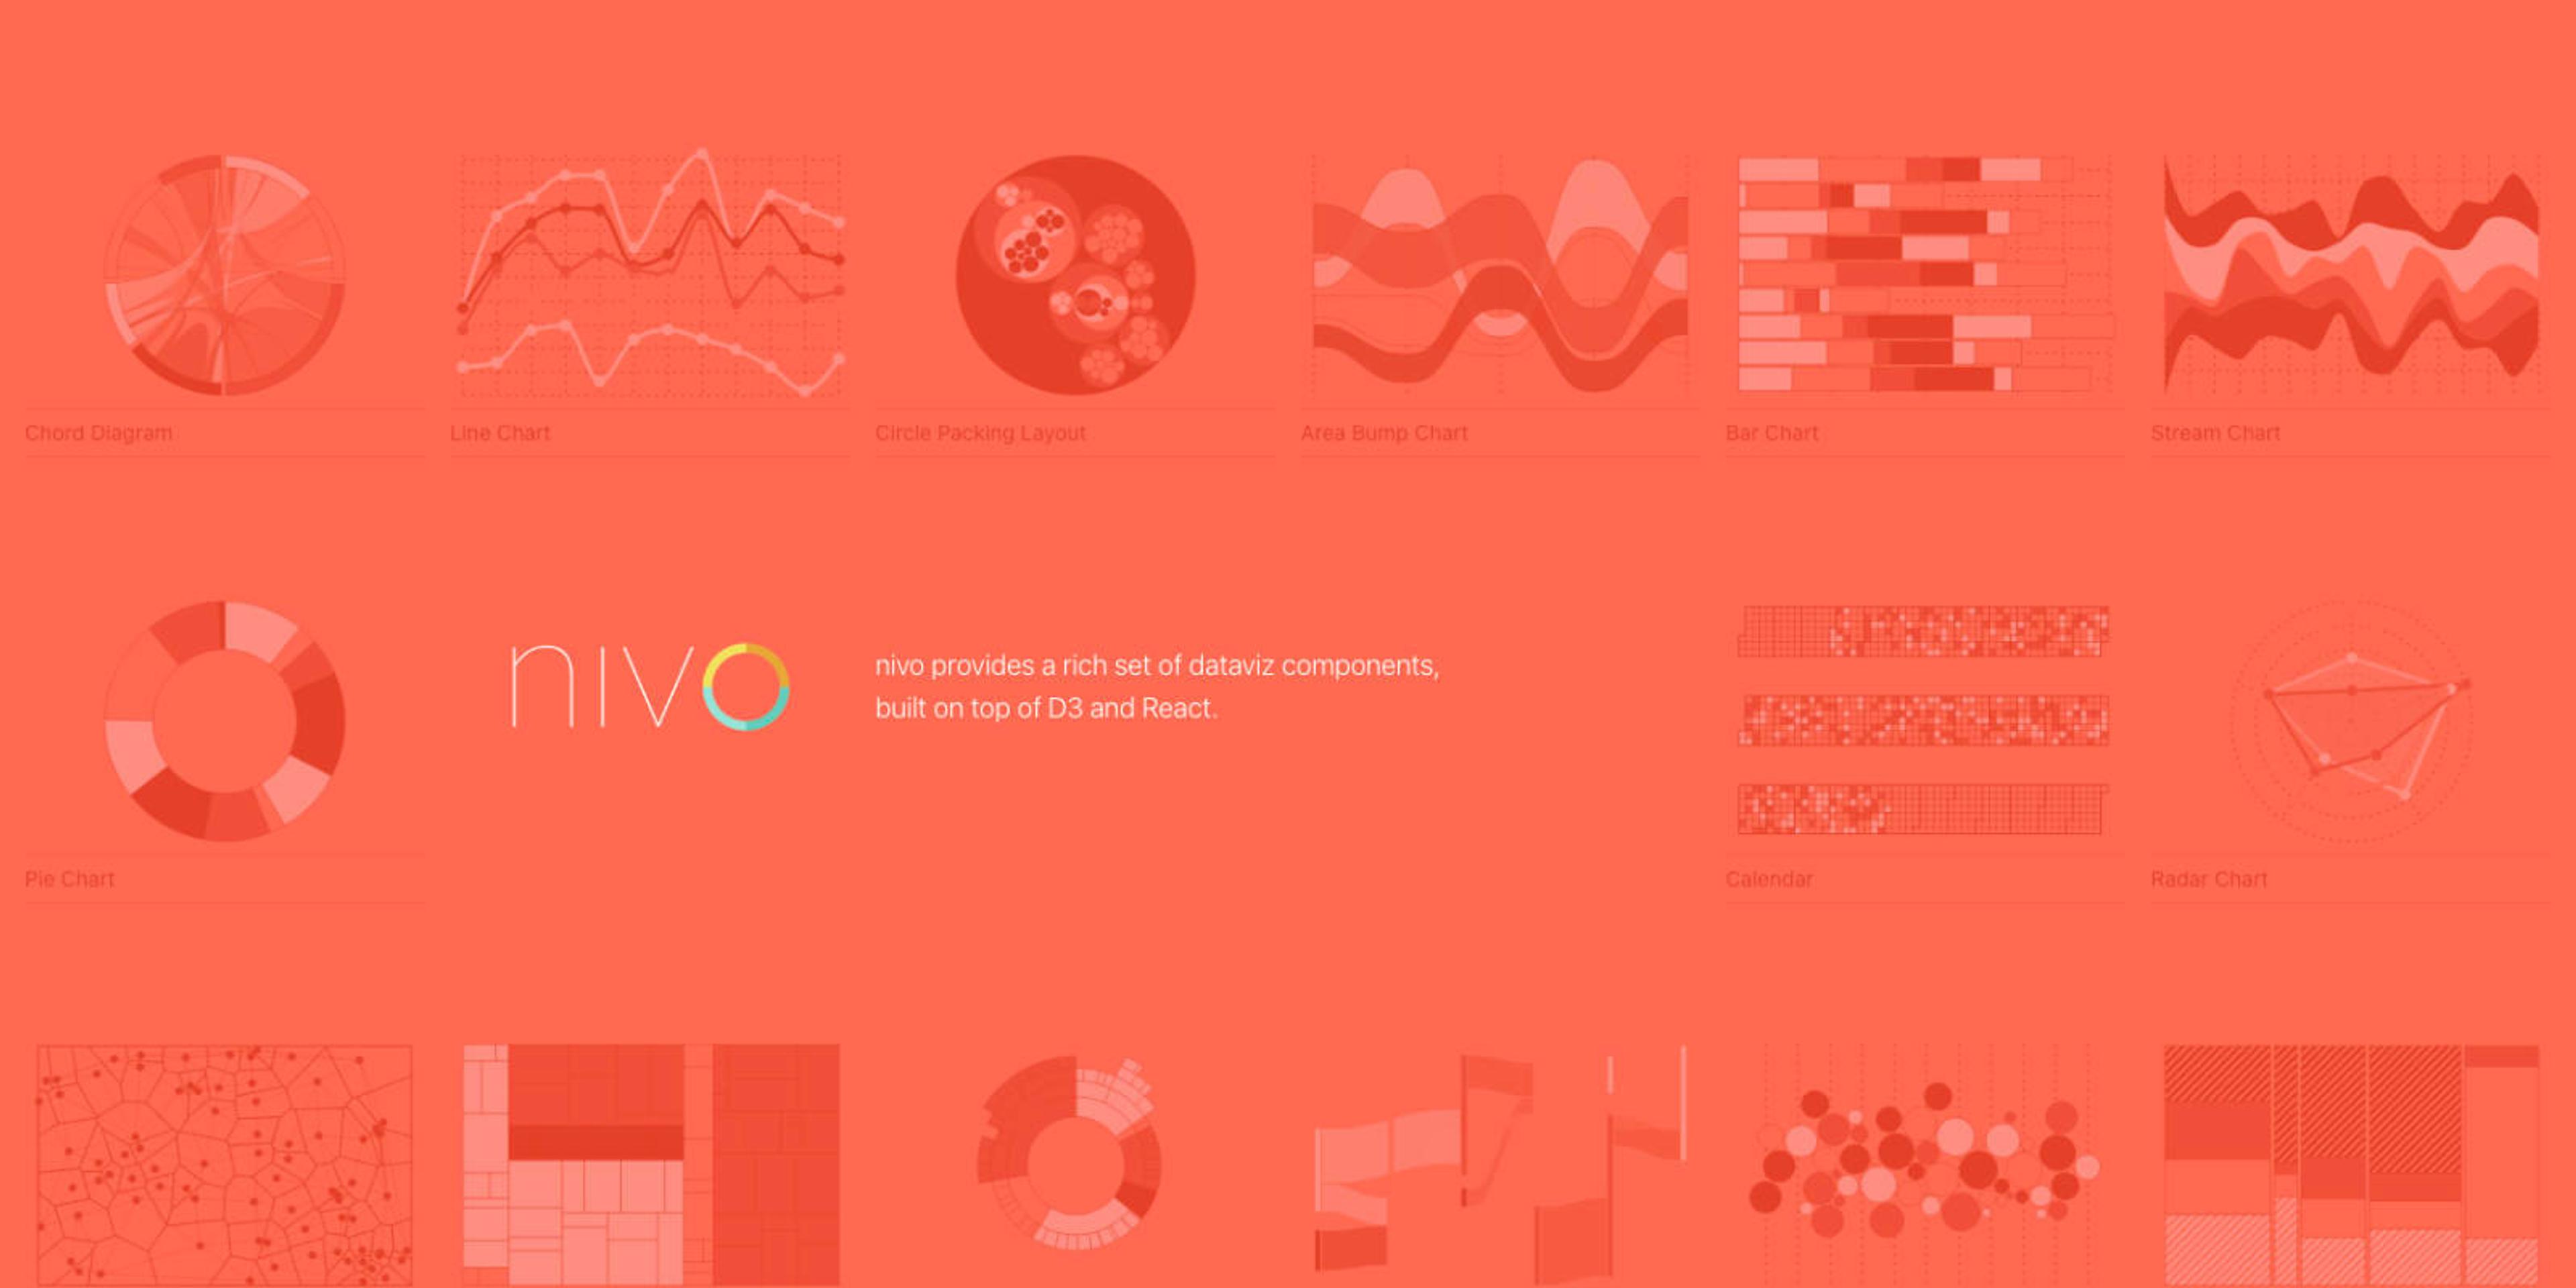
D3.js has been around forever. It is one of the most robust libraries when it comes to visualizing data with JavaScript. nivo provides a rich set of dataviz React components, built on top of D3. Co-created by Raphaël Benitte and Neil Kistner, it has an active community of contributors.
nivo is very well-maintained with a fair number of issues closed every month. Even though it is open-source and community-maintained, it has many backers through its Open Collective page. This is a big positive for the library because it means that organizations are invested in its’ longer-term maintenance.
Features
- Highly Customizable
- Motion/Transitions, powered by react-spring
- Interactive Components Playground
- Exhaustive Documentation
- SVG Charts
- HTML Charts
- Canvas Charts
- Server Side Rendering and HTTP API
- Patterns & Gradients
- Theming
- Responsive Charts
Chart Types
- AreaBump
- Bar
- CirclePacking
- Bump
- Bullet
- Calendar
- Choropleth
- Chord
- Funnel
- GeoMap
- HeatMap
- Line
- Marimekko
- Network
- ParallelCoordinates
- Pie
- Radar
- RadialBar
- Sankey
- ScatterPlot
- Stream
- Sunburst
- SwarmPlot
Conclusion
nivo could have easily made it to the top spot in our list. It has a large list of charting and data visualization components. Their example pages even allow you to play around with component properties and see the effects in real-time. It has a high amount of GitHub stars (10.7k) and is frequently used (1.4M downloads per month). Ultimately, deciding to use nivo will come down to the specific needs of your React project.
#3 Recharts
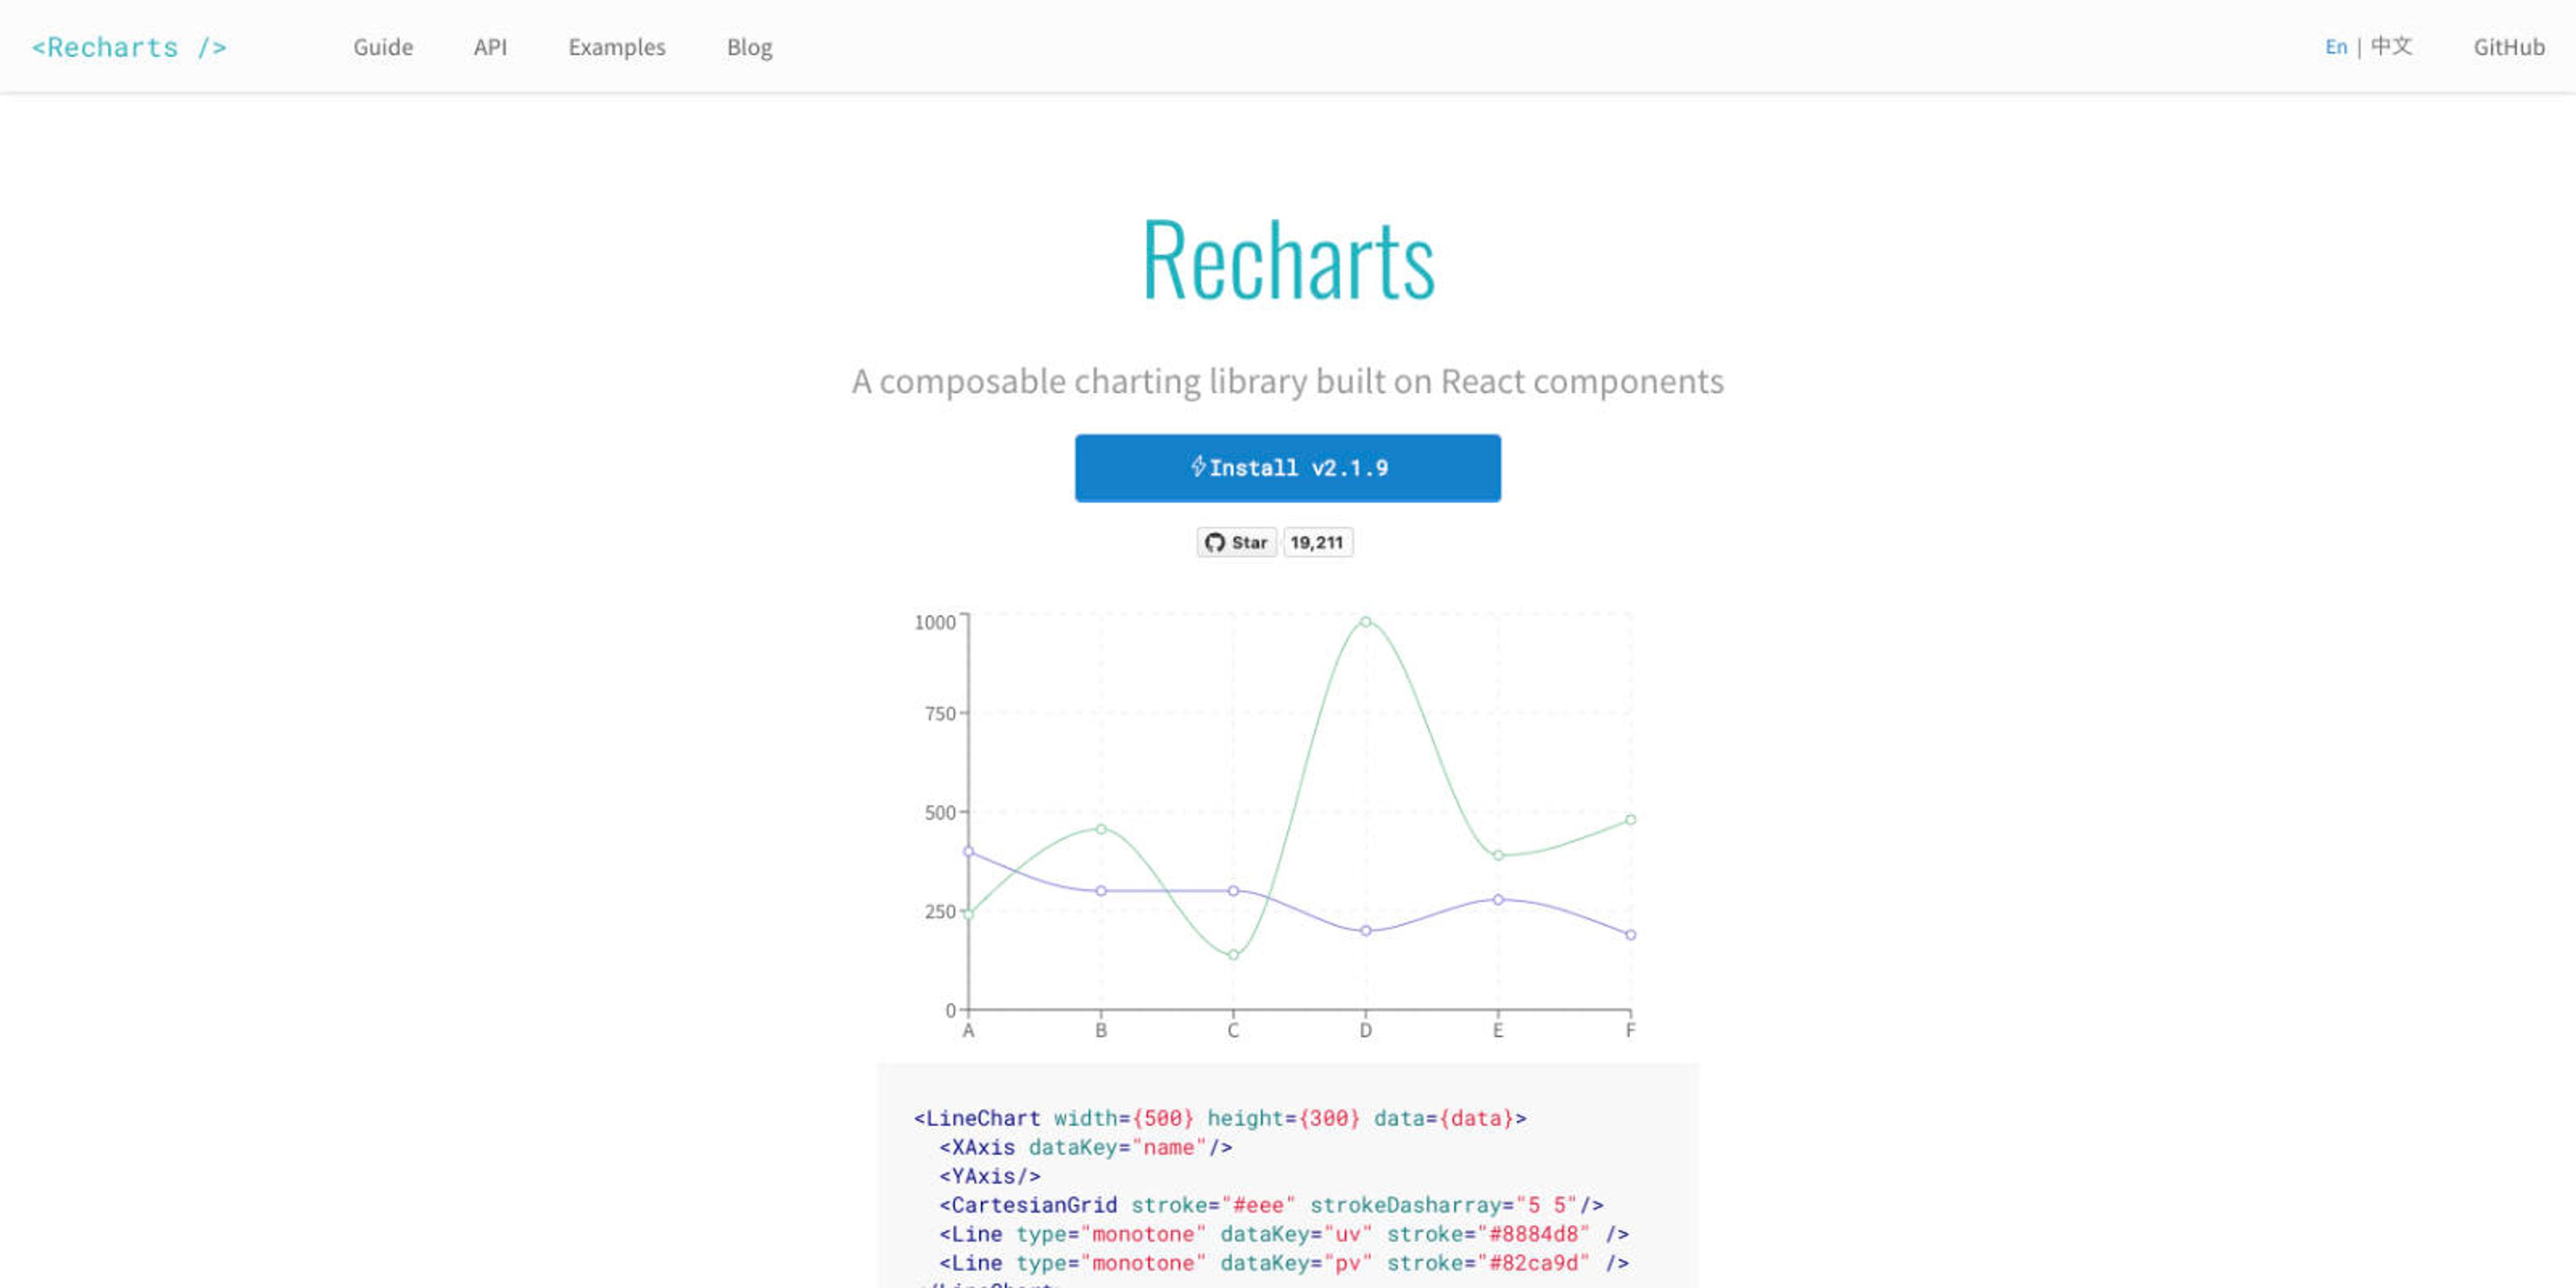
Recharts is arguably the most popular React charting library. It has 4.6M downloads per month and 19.2k GitHub stars. It has a large community of 224 contributors and a group of core maintainers called the Recharts Group. This means that you can expect more frequent bug fixes and new releases.
Recharts has also taken a more declarative approach. This makes their components very readable and easy to get started with. But, some may not prefer this approach as it could be considered more rigid and inflexible.
Features
- Composable
- Built on top of SVG elements
- Lightweight dependency on D3
- Customizable
Chart Types
- Area Chart
- Bar Chart
- Line Chart
- Composed Chart
- Pie Chart
- Radar Chart
- Radial Bar Chart
- Scatter Chart
- Funnel Chart
- Treemap
- Sankey Chart
Conclusion
If you are looking for a chart library for your React application, you should always consider Recharts. It is the largest and most popular React-based charting library today. Unfortunately, that comes with some detriments. Recharts currently has 464 open issues. This could be because of the way they manage their GitHub issues. But, it is a significant number compared to other libraries like react-chartjs-2 (45) and nivo (92). Being such a large and popular open-source codebase means that updates and bug fixes may not come as quickly or often. Yet, it has been around for a long time as well, which means that it is likely more stable.
#4 Victory
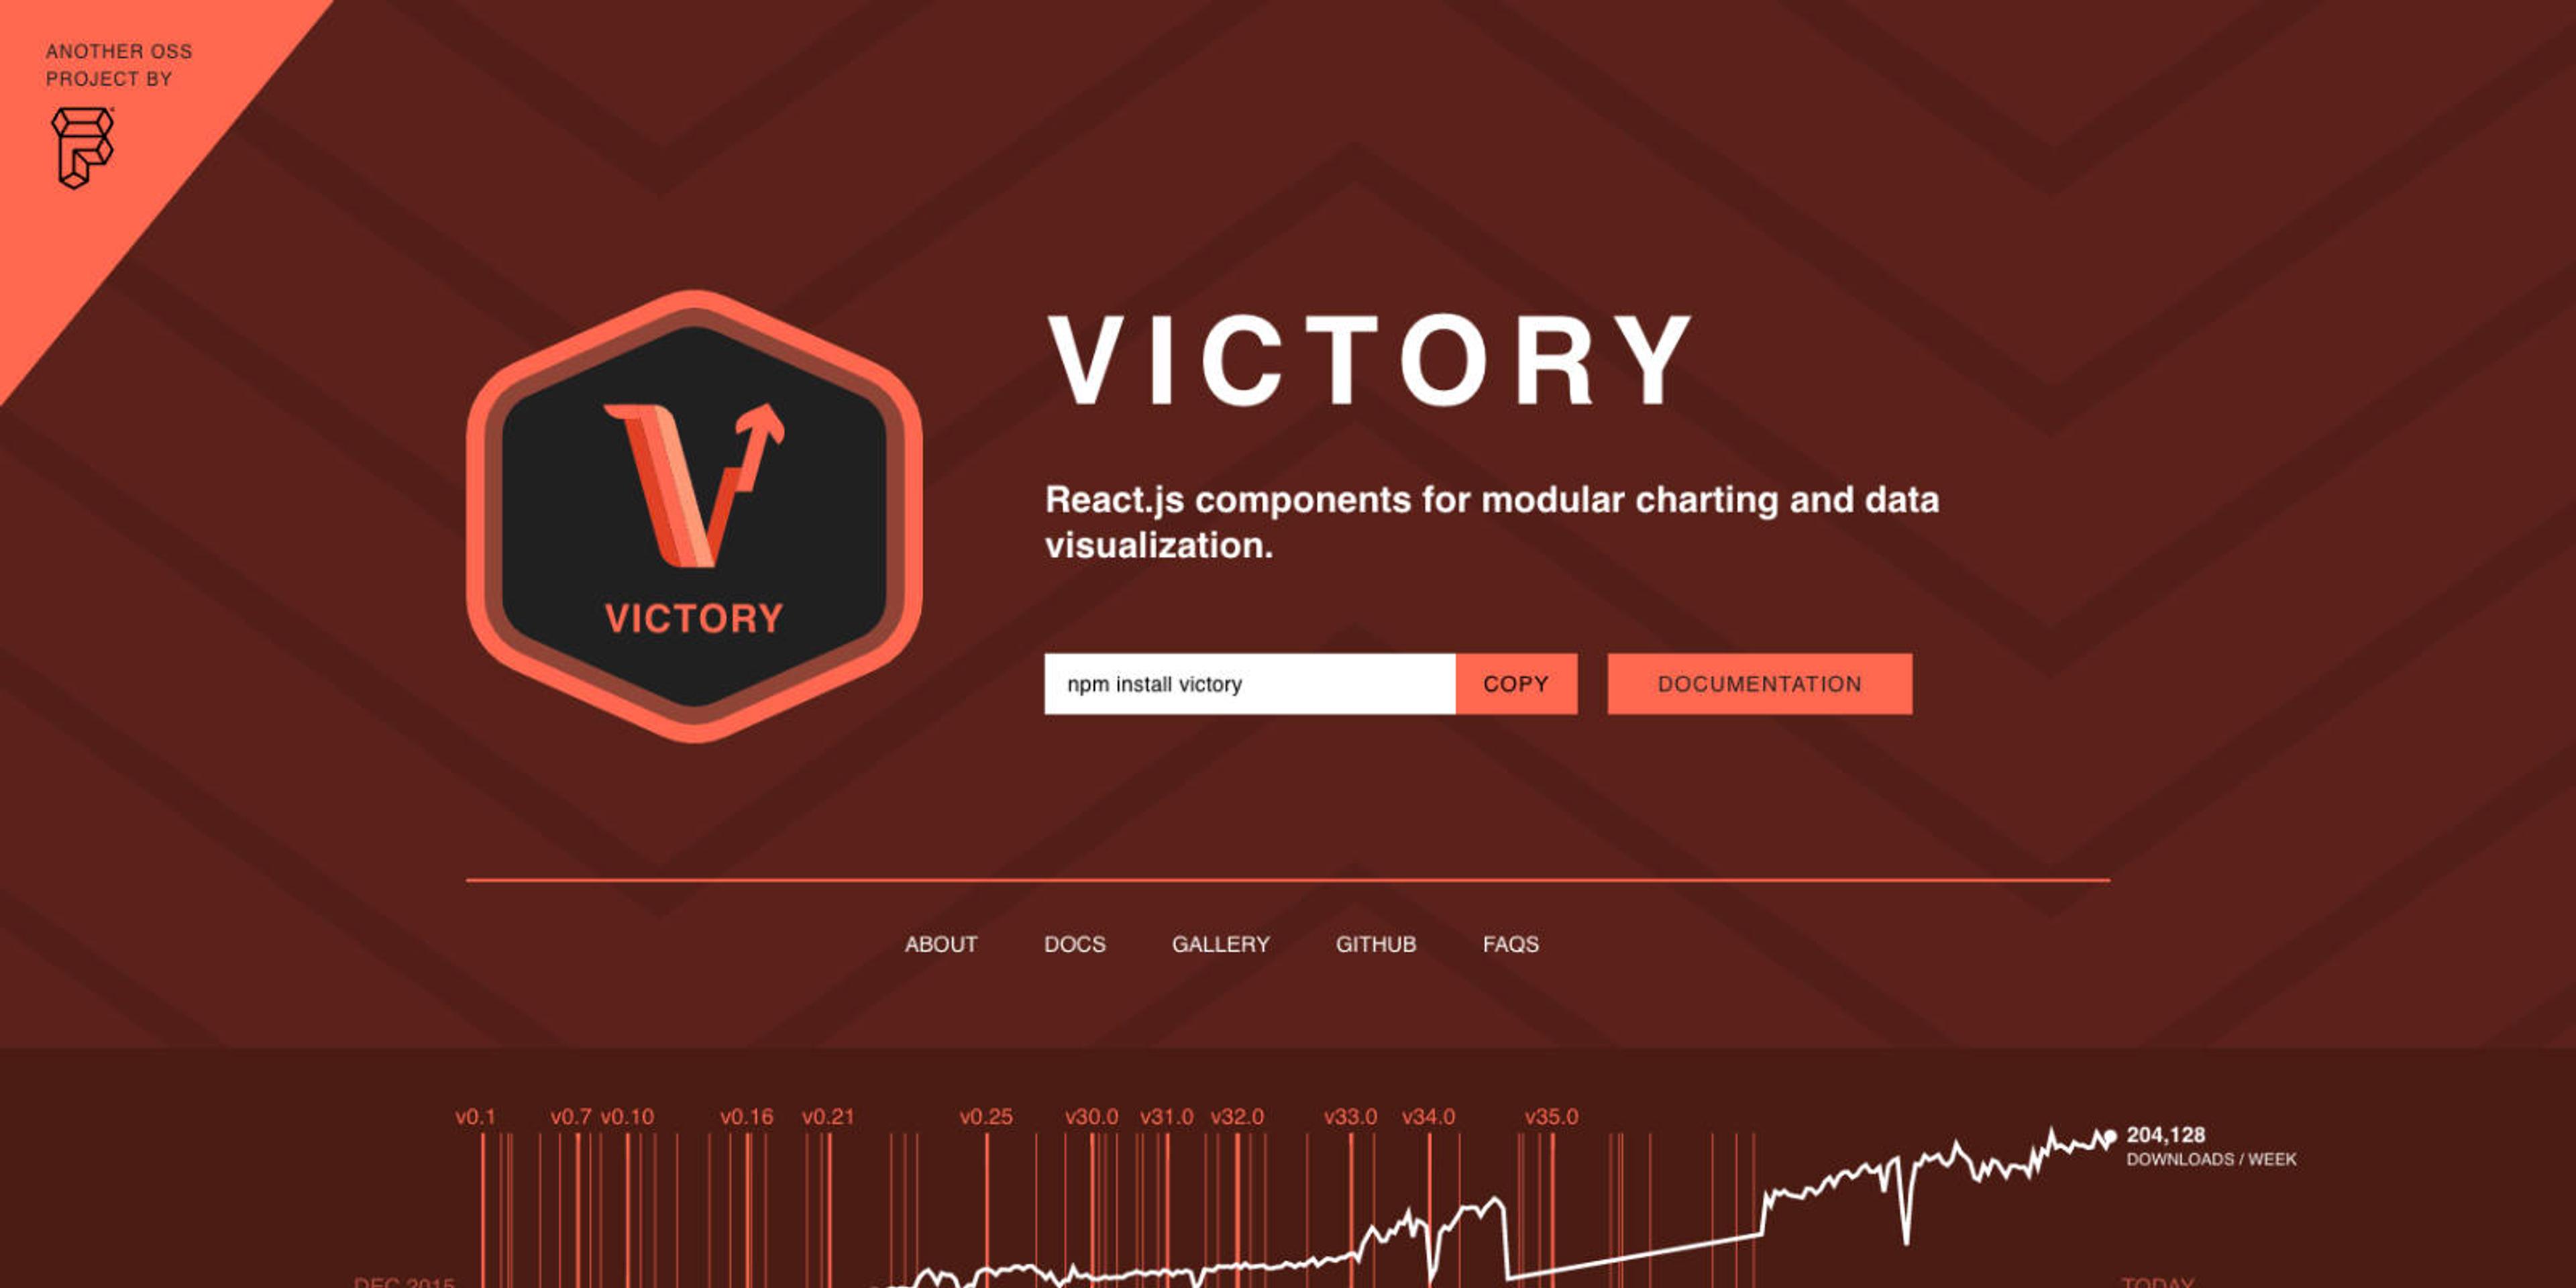
Formidable has built some of the most popular JavaScript libraries in recent years. This includes Victory. Formidable has been around for a while. They have some notable clients including Microsoft, Google, and Starbucks. Victory has beautiful and unique chart designs out-of-the-box. Check then out in their gallery of examples.
Victory has a clean and easy-to-understand API. This makes the implementation of its charts straightforward and quick. If you need help getting started, they have very robust and approachable documentation. Victory also has a set of React Native charting components called Victory Native.
Features
- Robust
- Easy-to-use components
- Flexible
- Fully contained and reusable data visualization elements
- Extensible
Chart Types
Advertisement
- VictoryChart
- VictoryErrorBar
- VictoryGroup
- VictoryLine
- VictoryPie
- VictoryPolarAxis
- VictoryScatter
- VictoryStack
- VictoryVoronoi
- VictoryHistogram
Conclusion
We’ve loved the open-source projects that have come from Formidable. Aside from being one of the most popular React charting libraries (10k GitHub stars and 208k downloads per week), Victory has a lot of things going for it. It does have 212 open GitHub issues. But that is not an unreasonable amount considering its popularity and active community.
#5 visx
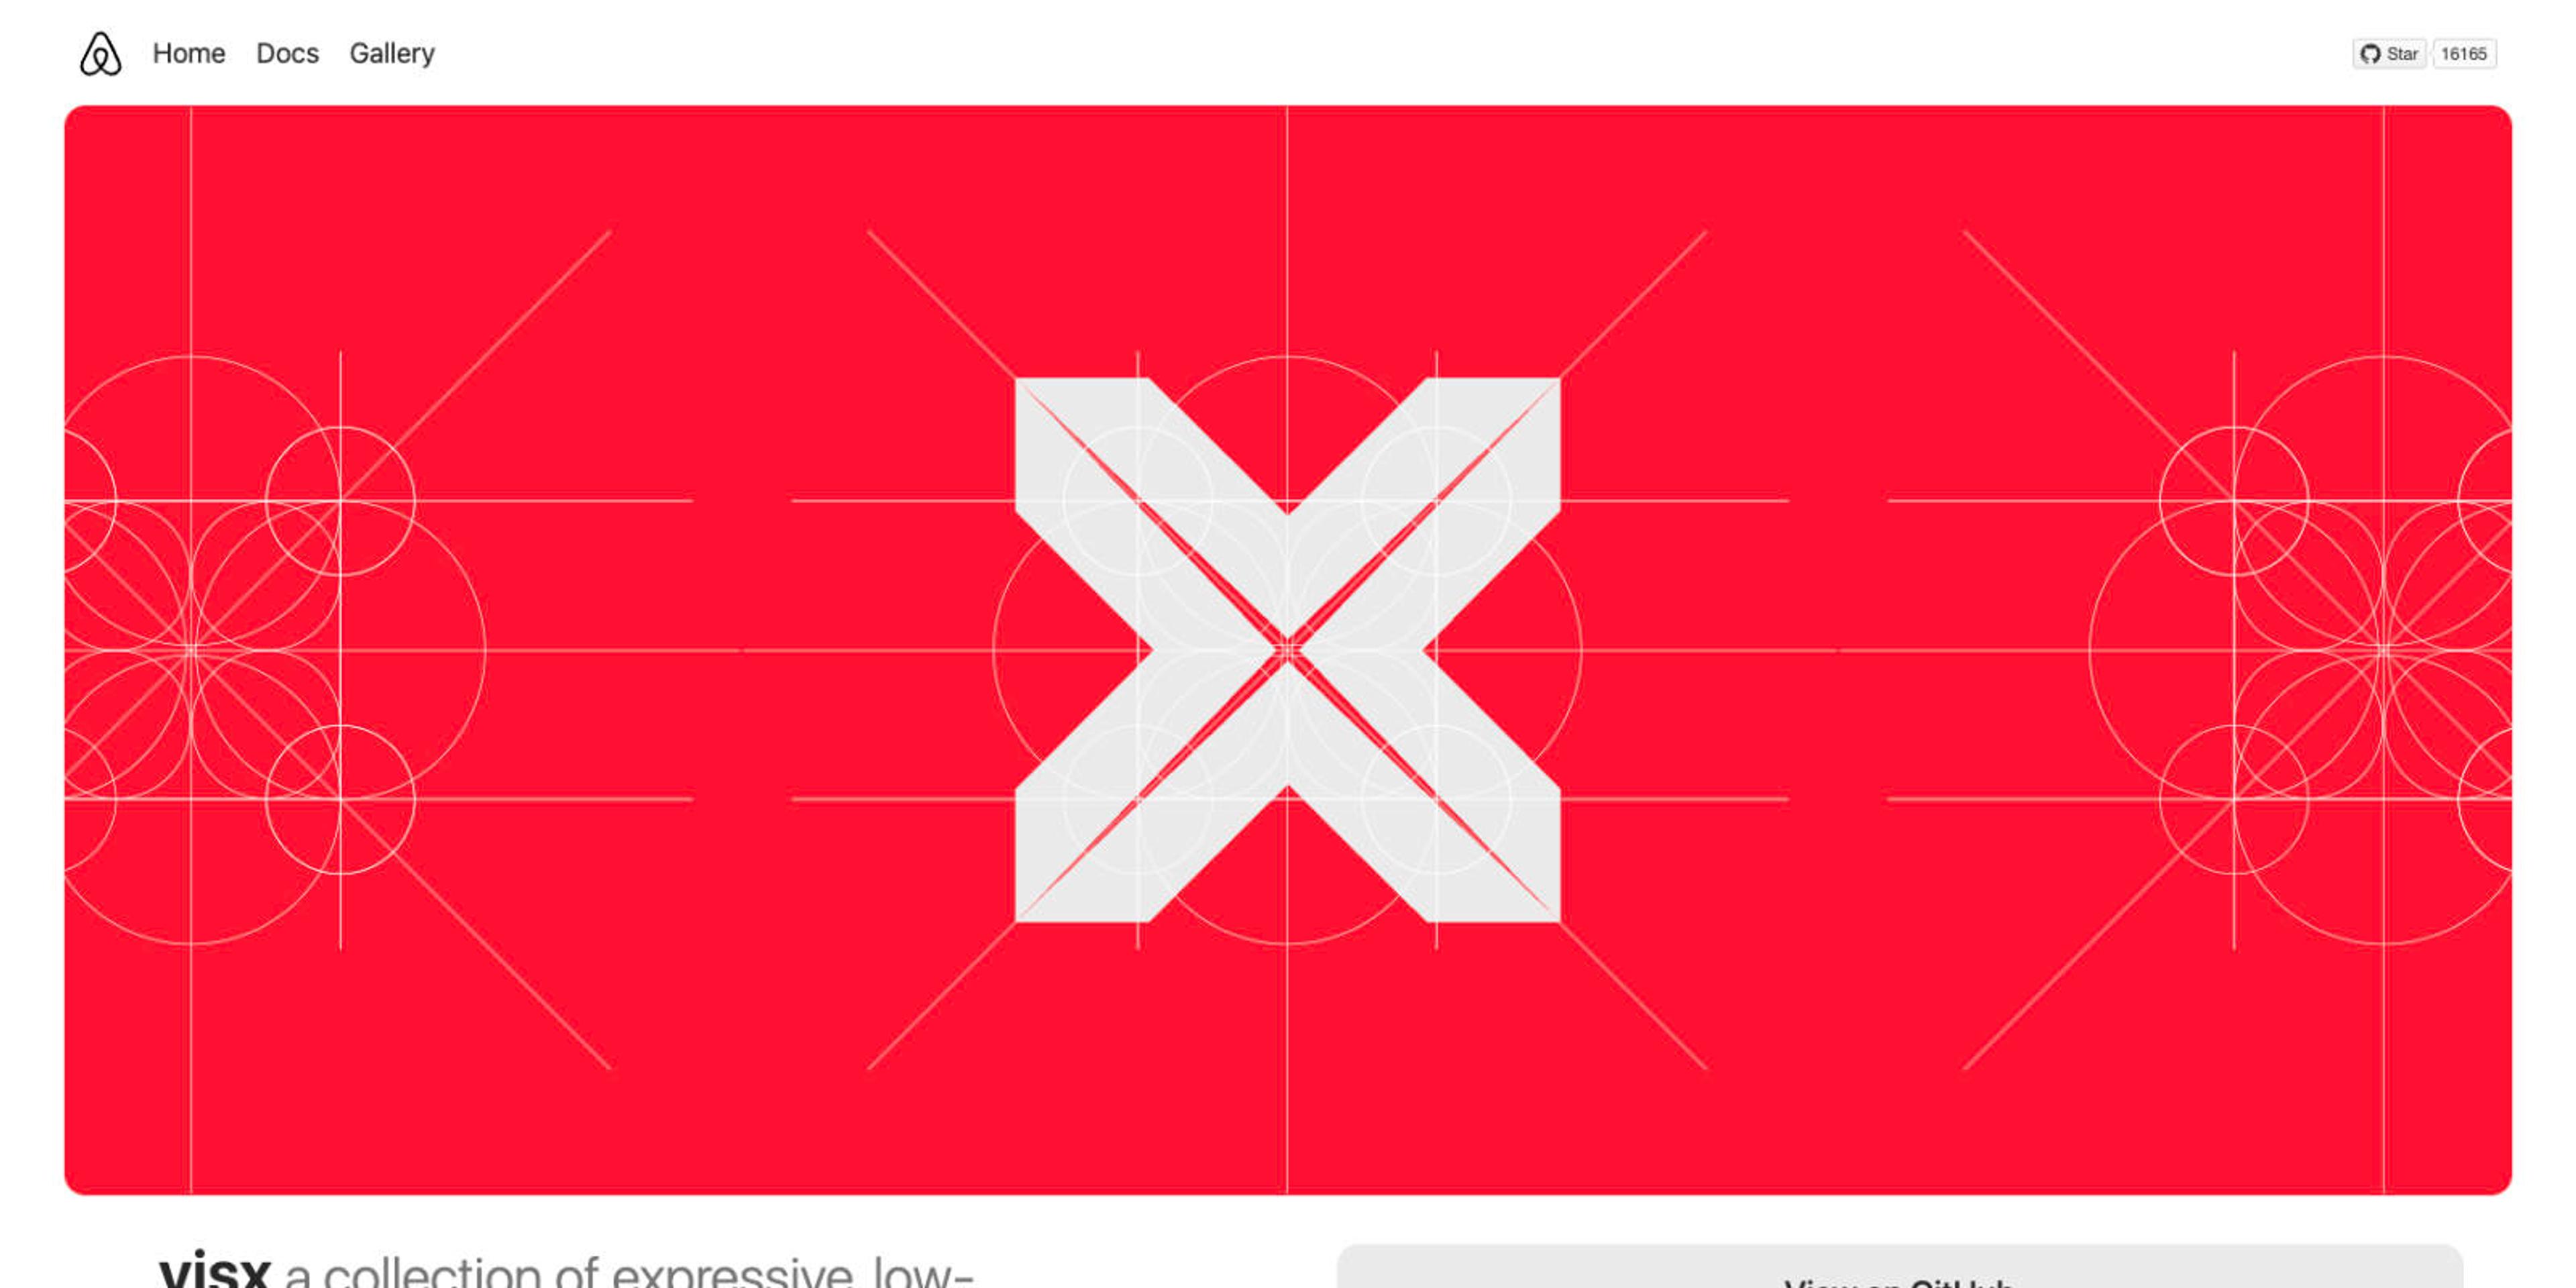
The only reason that visx is not higher on our list is that it is not technically a charting library. visx considers itself “a collection of expressive, low-level visualization primitives for React”. That said, when you look at this library, you’ll completely understand why we needed to include it in our list.
visx was beautifully designed by the team at Airbnb. It has some of the most unique and modern dataviz components, as you can see in their gallery. With 16.2k GitHub stars and 1.1M downloads per month, it is a very popular library, to say the least.
Features
- Keep bundle sizes down. visx is split into multiple packages. Start small and use only what you need.
- Un-opinionated on purpose. Bring your own state management, animation library, or CSS-in-JS solution. Odds are good your React app already has an opinion on how animation, theming, or styling is done. visx is careful not to add another one and integrates with all of them.
- Not a charting library. As you start using visualization primitives, you’ll end up building your own charting library that’s optimized for your use case. You’re in control.
- And most importantly — it’s just React. If you know React, you can make visualizations. It’s all the same standard APIs and familiar patterns. visx should feel at home in any React codebase.
Chart Types
- annotation
- axis
- curve
- glyph
- grid
- legend
- marker
- scale
- shape
- tooltip
- chord
- geo
- heatmap
- hierarchy
- network
- react-spring
- stats
- threshold
- wordcloud
- xychart
Conclusion
visx could easily rank higher on our list except that it is not a charting library. It is also purposely lower-level and unopinionated. So that you can build your own set of charts using your own state management, animation, or styling. This means that visx is not a good solution for developers looking for charts out of the box. That said, if you are looking to build custom data visualizations, then we would recommend that you give visx a try.
#6 React Charts
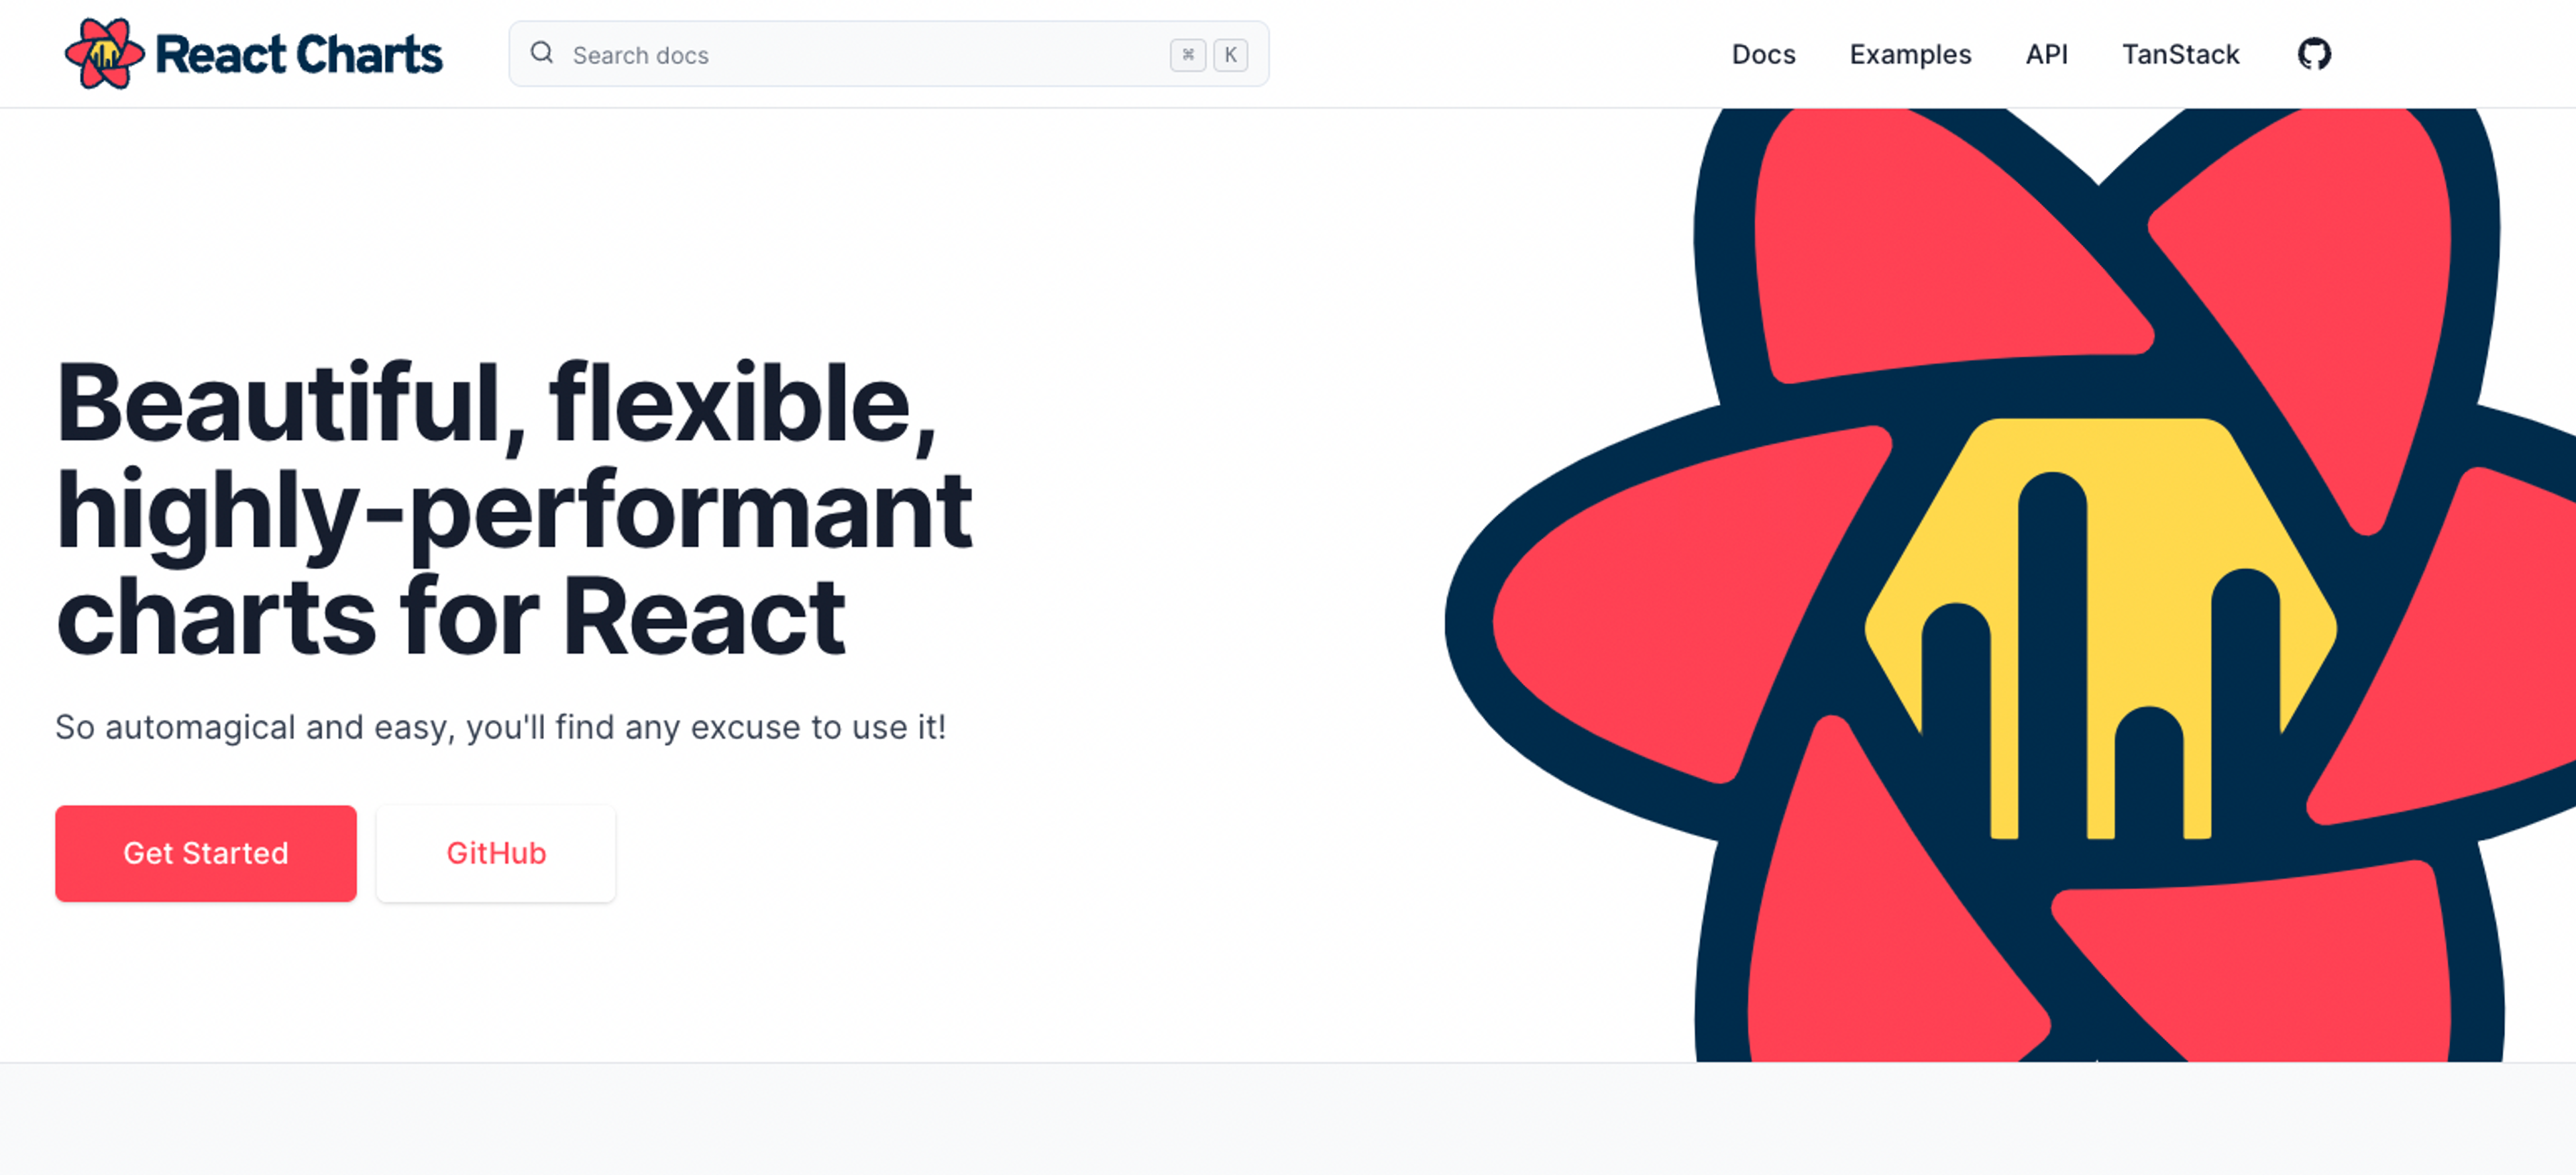
React Charts is a straightforward set of declarative React chart components created by Tanner Linsley. This library is not as popular (2.3k GitHub stars and 79k downloads per month) as the other libraries on our list. But we decided to give it a spot because it is almost entirely maintained by one person. This is not an easy feat, and Tanner deserves a lot of credit for what he’s accomplished with his open-source work.
React Charts is opinionated in that it only contains X/Y charts. A quote from their website states: “We believe data visualization is all about effectively conveying information to your users, and not about building new and"exciting" methods of indirection or "art" for them to ponder and decipher. To that end, React Charts only supports X/Y chart layouts and purposefully does not have support for pie charts, radar charts, or other circular nonsense.”. It also has a Discord community where you can ask questions, get help, and talk about issues.
Features
- Succinct & Declarative
- X/Y-Only Charts
- SVG Knowledge Optional
- Hyper Responsive
- Invisibly Powered by D3
- Declarative
Chart Types
- Line Charts
- Bar/Column Charts
- Bubble/Scatter Charts
- Area/Steam Charts
- Axis Stacking
- Inverted Axes
- Mutliple Axes
Conclusion
Using a library that is solely maintained by one person is a risk. That said, Tanner has been maintaining React Charts for quite a few years. And he seems quite committed to continuing support on his open-source projects. The repo also has 29 contributors and 196 forks, which means that there is an active community. If you’re looking for an easy-to-use set of X/Y charts and graphs that works out of the box, then you should definitely try out React Charts.
Bonus: react-vis
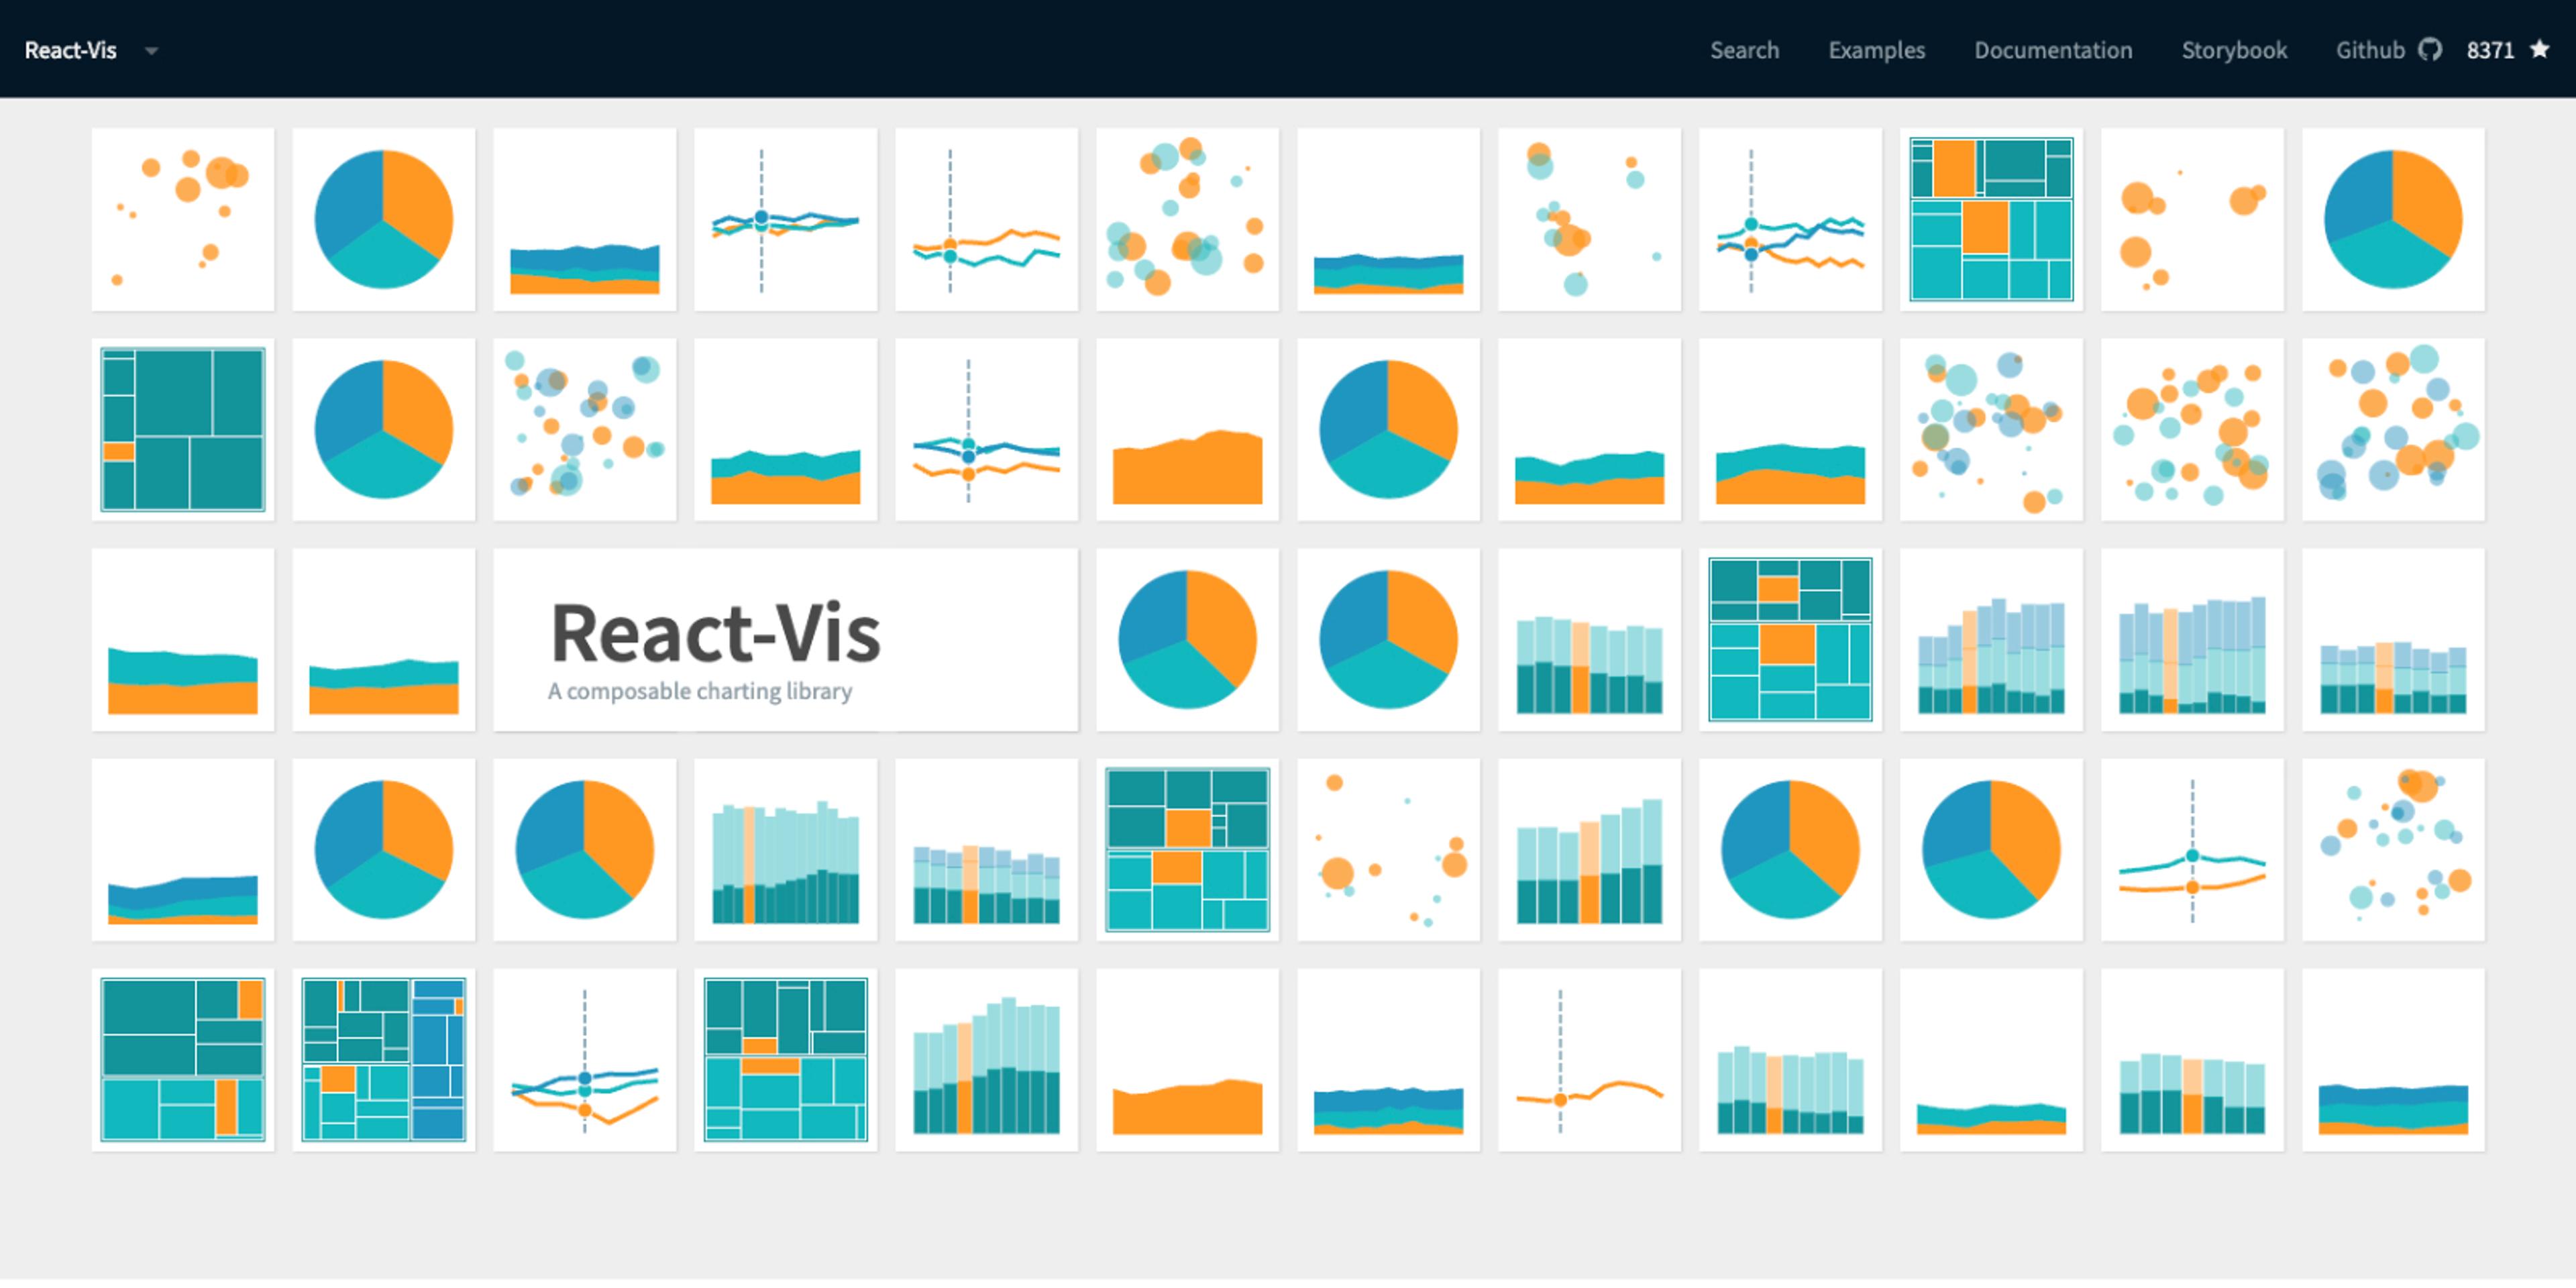
react-vis was built by the open-source team at Uber. We wanted to add this library as a bonus to our list because it is still popular with 8.4k GitHub stars and 436k downloads per month. Unfortunately, react-vis has been officially deprecated and the Uber team is no longer supporting it. That said, the community is still active, with the last pull request merged in on November 9, 2022 as of this writing.
react-vis is similar to visx. It offers several Series’ of composable components for different types of data visualizations. This may be a little more involved than necessary if you are only looking for charting or graphing components. But if you are looking for a robust and well-documented library for dataviz, then it is definitely worth checking out.
Features
- Simplicity. react-vis doesn't require any deep knowledge of data visualization libraries to start building your first visualizations.
- Flexibility. react-vis provides a set of basic building blocks for different charts. For instance, separate X and Y axis components. This provides a high level of control of chart layout for applications that need it.
- Ease of use. The library provides a set of defaults which can be overridden by the custom user's settings.
- Integration with React. react-vis supports the React's lifecycle and doesn't create unnecessary nodes.
Chart Types
- Scales and Data
- Animations
- XYPlot
- RadialChart
- Treemap
- Sankey
- Radar Chart
- Parallel Coordinates
- Sunbursts
- Legends
Conclusion
We are always hesitant when it comes to using deprecated libraries. Use it with caution and understand the risks. That said, react-vis still does have an active community of contributors (119). It is a robust and extensive set of well-designed data visualization components. So at the very least, it is worth trying out if you need to do some complex or custom dataviz work in your project.
Bonus Library: React Stockcharts
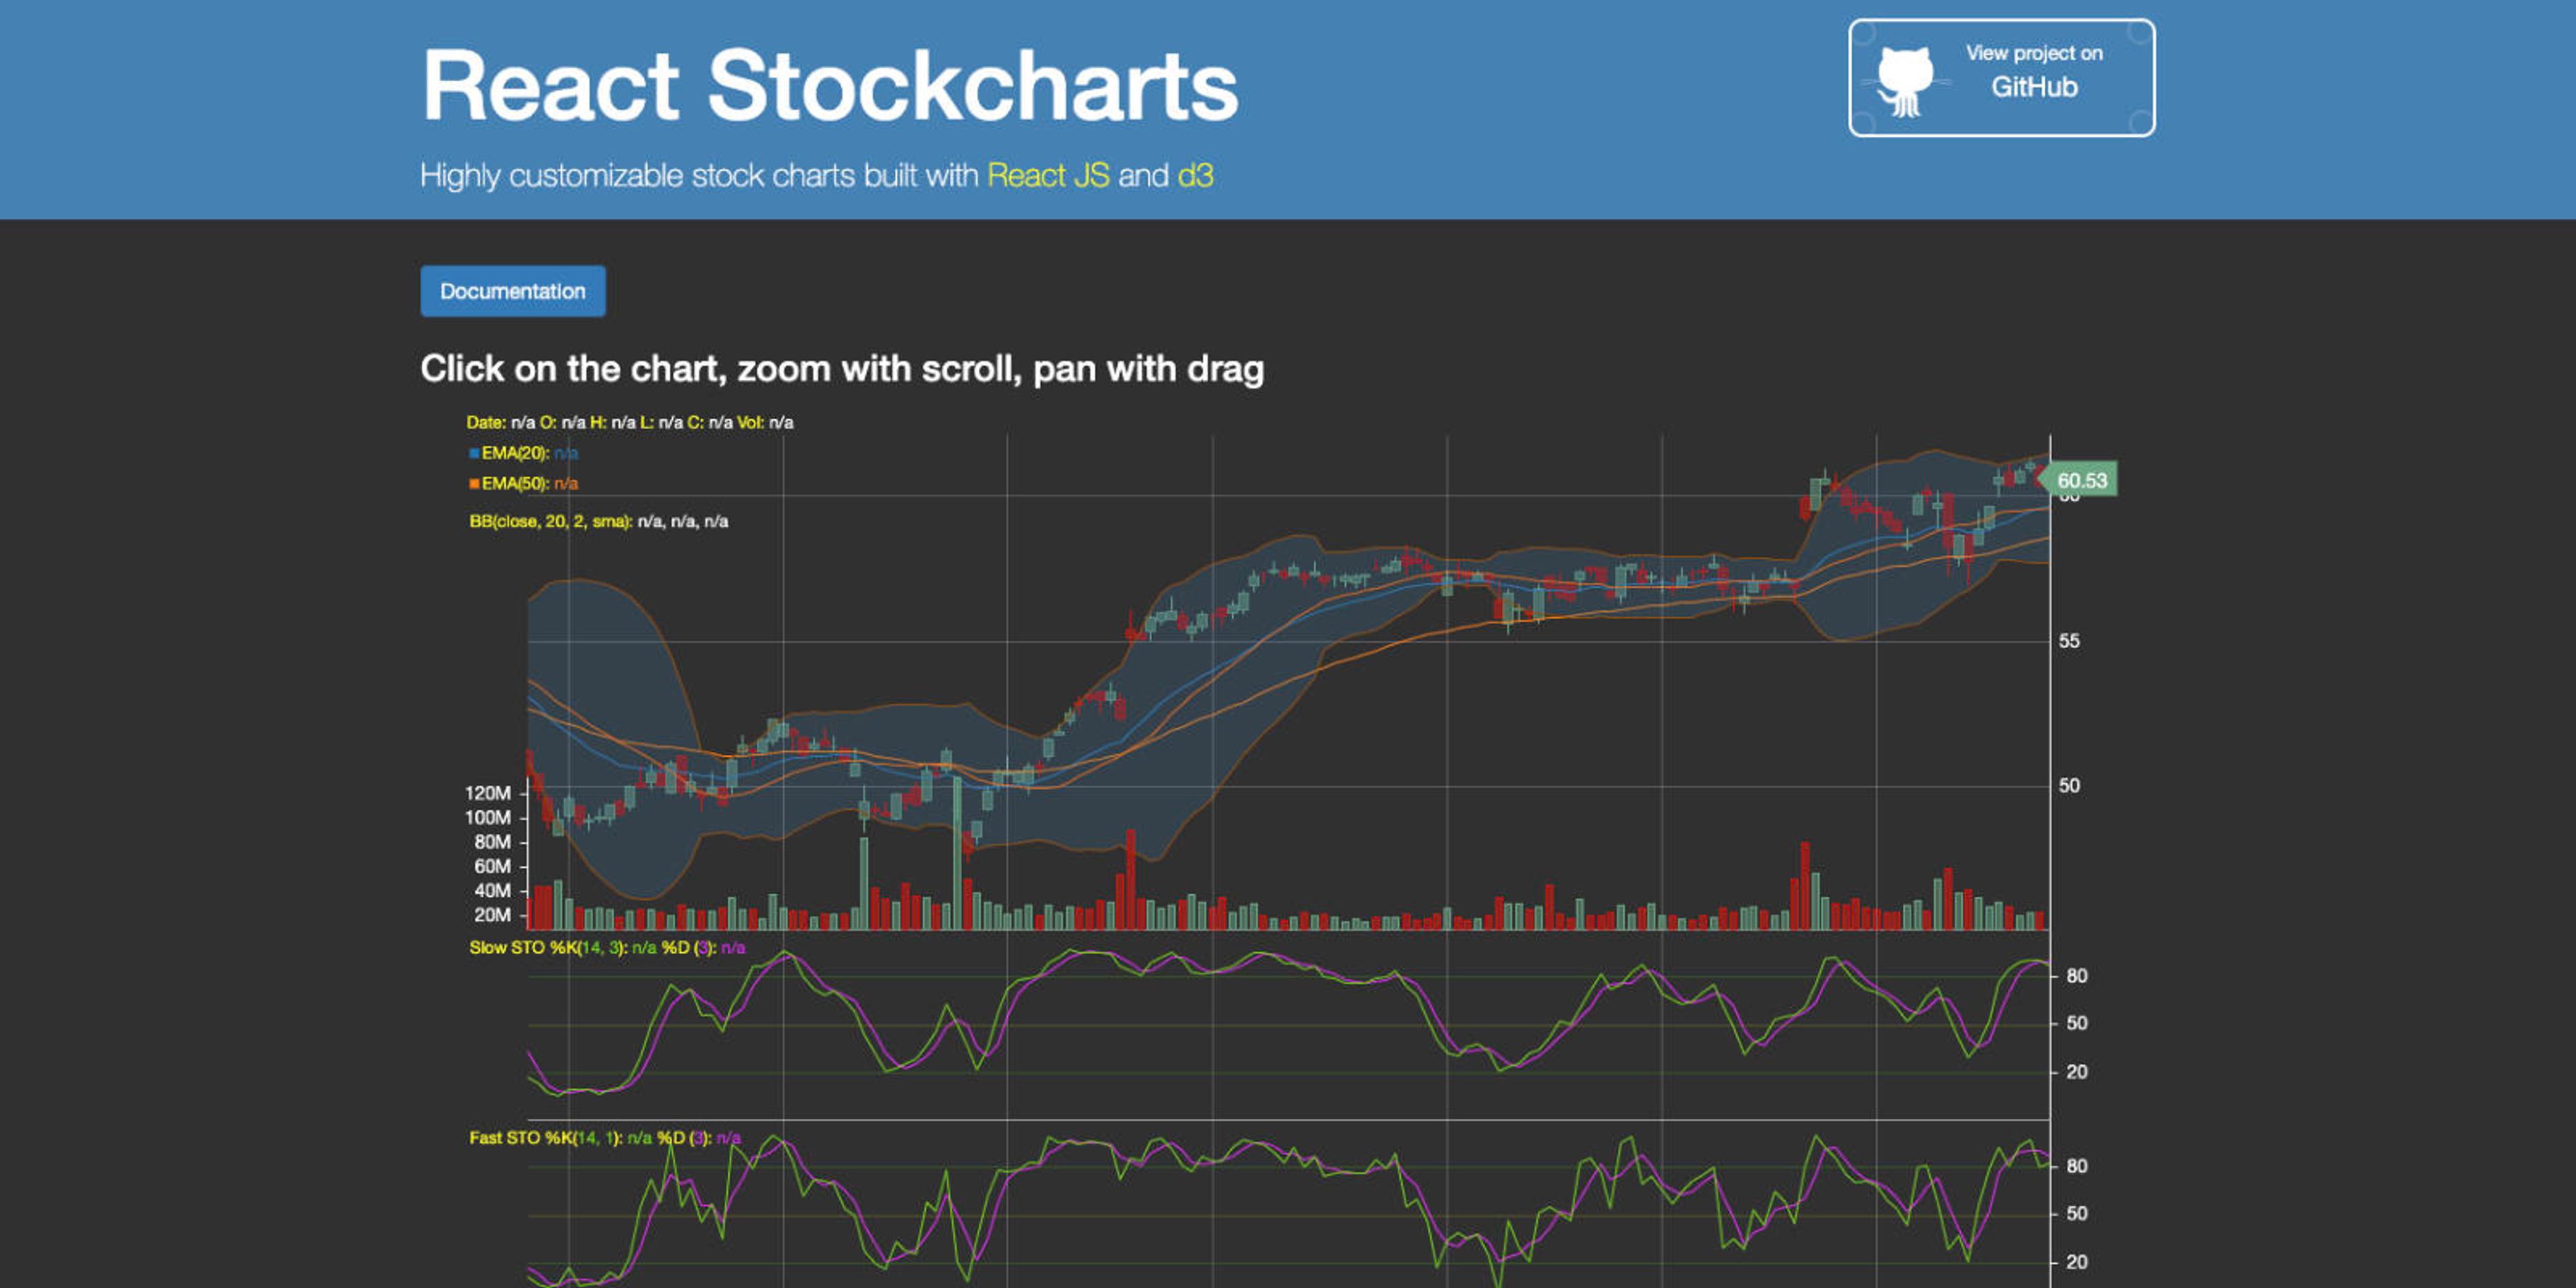
React Stockcharts is not a typical charting library. It provides a number of common charts, like Area, Line, and Bar. But it specifically focuses on helping you to build stock charts. It is built on top of D3.js and has extensive features. It provides you with the ability to create complex stock charts that you can zoom with scroll and pan with drag.
Features
- SVG and Canvas for improved performance.
- Pan and zoom on touch devices
Chart Types
- Area Chart
- Line & Scatter
- Bubble Chart
- Bar Chart
- Grouped Bar Chart
- Stacked Bar Chart
- Horizontal Bar Chart
- Horizontal Stacked Bar
- Candlestick Chart
- Volume bar
- Heikin Ashi
- Kagi
- Point & Figure
- Renko
- Misc Charts
Conclusion
Unfortunately, React Stockcharts is not very active. It is primarily maintained by one person and the last update was Sep 5, 2018. The reason that we've included it is that there does not seem to be a better alternative for stock charts. It is the most extensive library when it comes to features. Just check out the documentation. It offers many of the features that competitors charging for. If you're looking for a React library for stock charts, React Stockcharts should be an obvious consideration.
Summary
Finding the right charting library for your React project can be a challenge. You need to consider your data visualization needs in the present and in the future of your project. As your app scales, your choice of library will be crucial. Swapping out charting libraries will likely be impossible, so the research phase is critical in making your decision.
There is a myriad of options out there. That's why we did the research and created this list of the best React charting libraries we could find. We wanted to save you time. That way you can focus on the fun part of diving into the code, prototyping, and deciding which library is the best fit for your project.